2015 Worldwide Hurricane Summary
November 30, 2015 at 2:47 pm EST
There comes a time when we must all say goodbye, and today we are saying goodbye to the 2015 Hurricane Season. I have to be a little more clear on this. There are seasons associated with hurricanes and they are different for each ocean basin. However, November 30 marks the last day of hurricane season for the Atlantic Ocean, the East Pacific Ocean and the Central Pacific Ocean. These are the ocean basins that I usually research and study but I also like to look at the West Pacific Basin and the Indian Ocean. Unlike in the western hemisphere, the eastern hemisphere (mainly talking about the West Pacific Ocean) does not have a hurricane season (known as a “typhoon” season in that part of the world). Instead typhoon season occurs year-round, with a peak in September-October and a decrease in February-March.
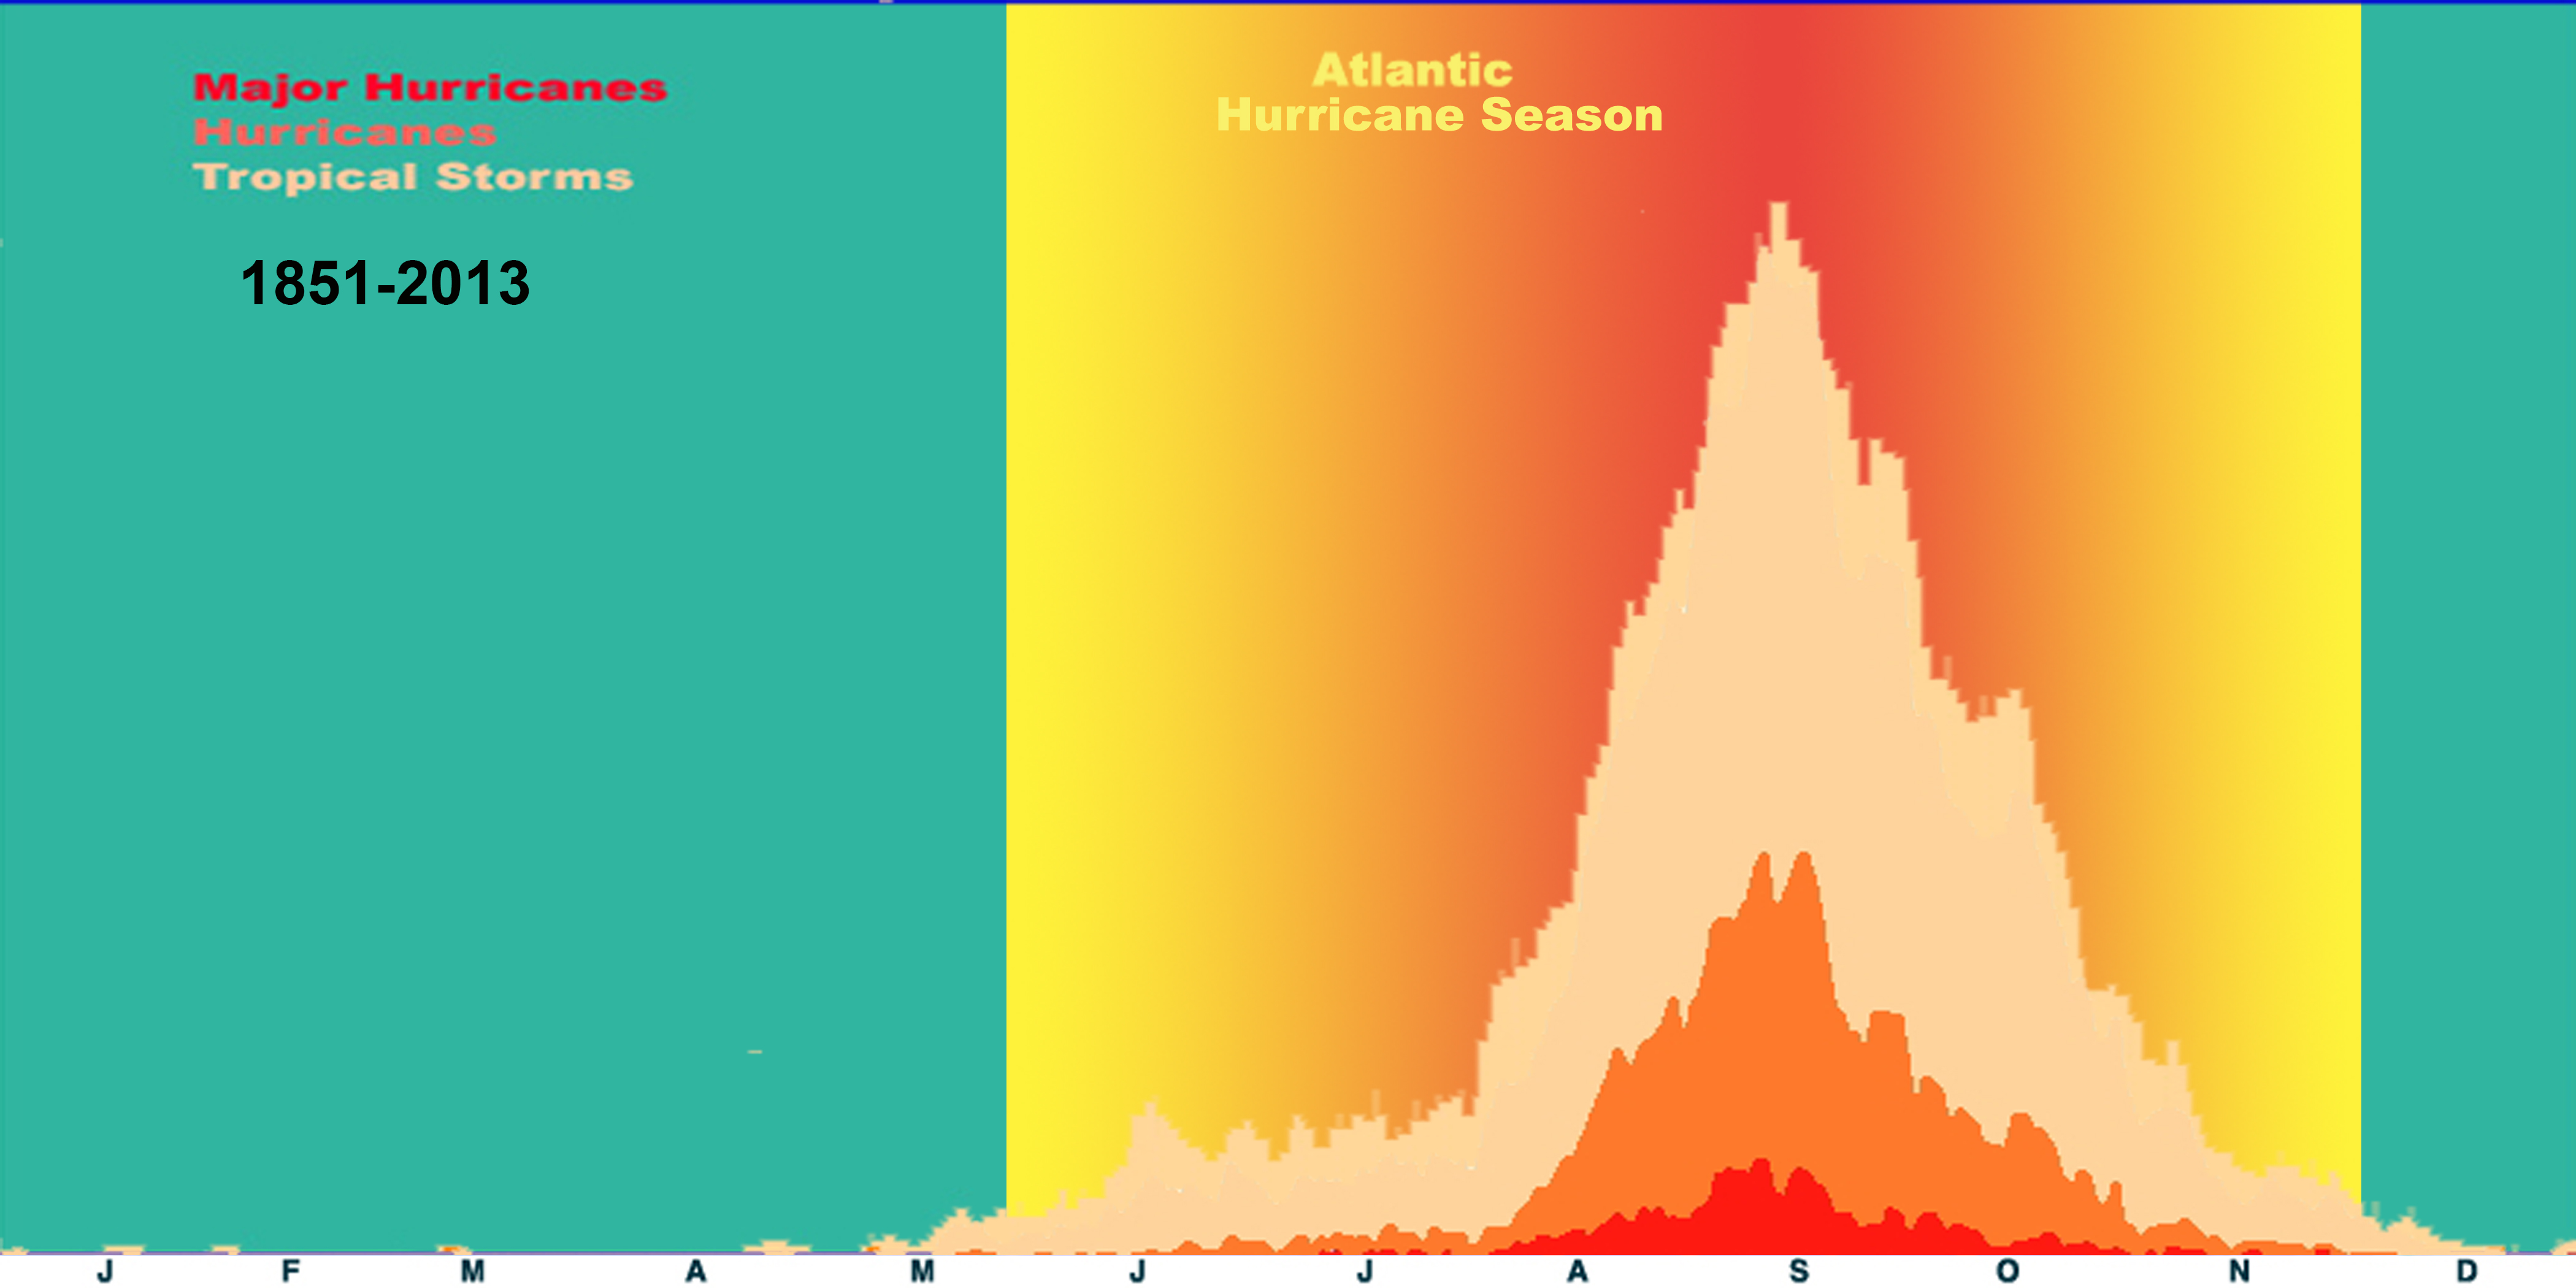
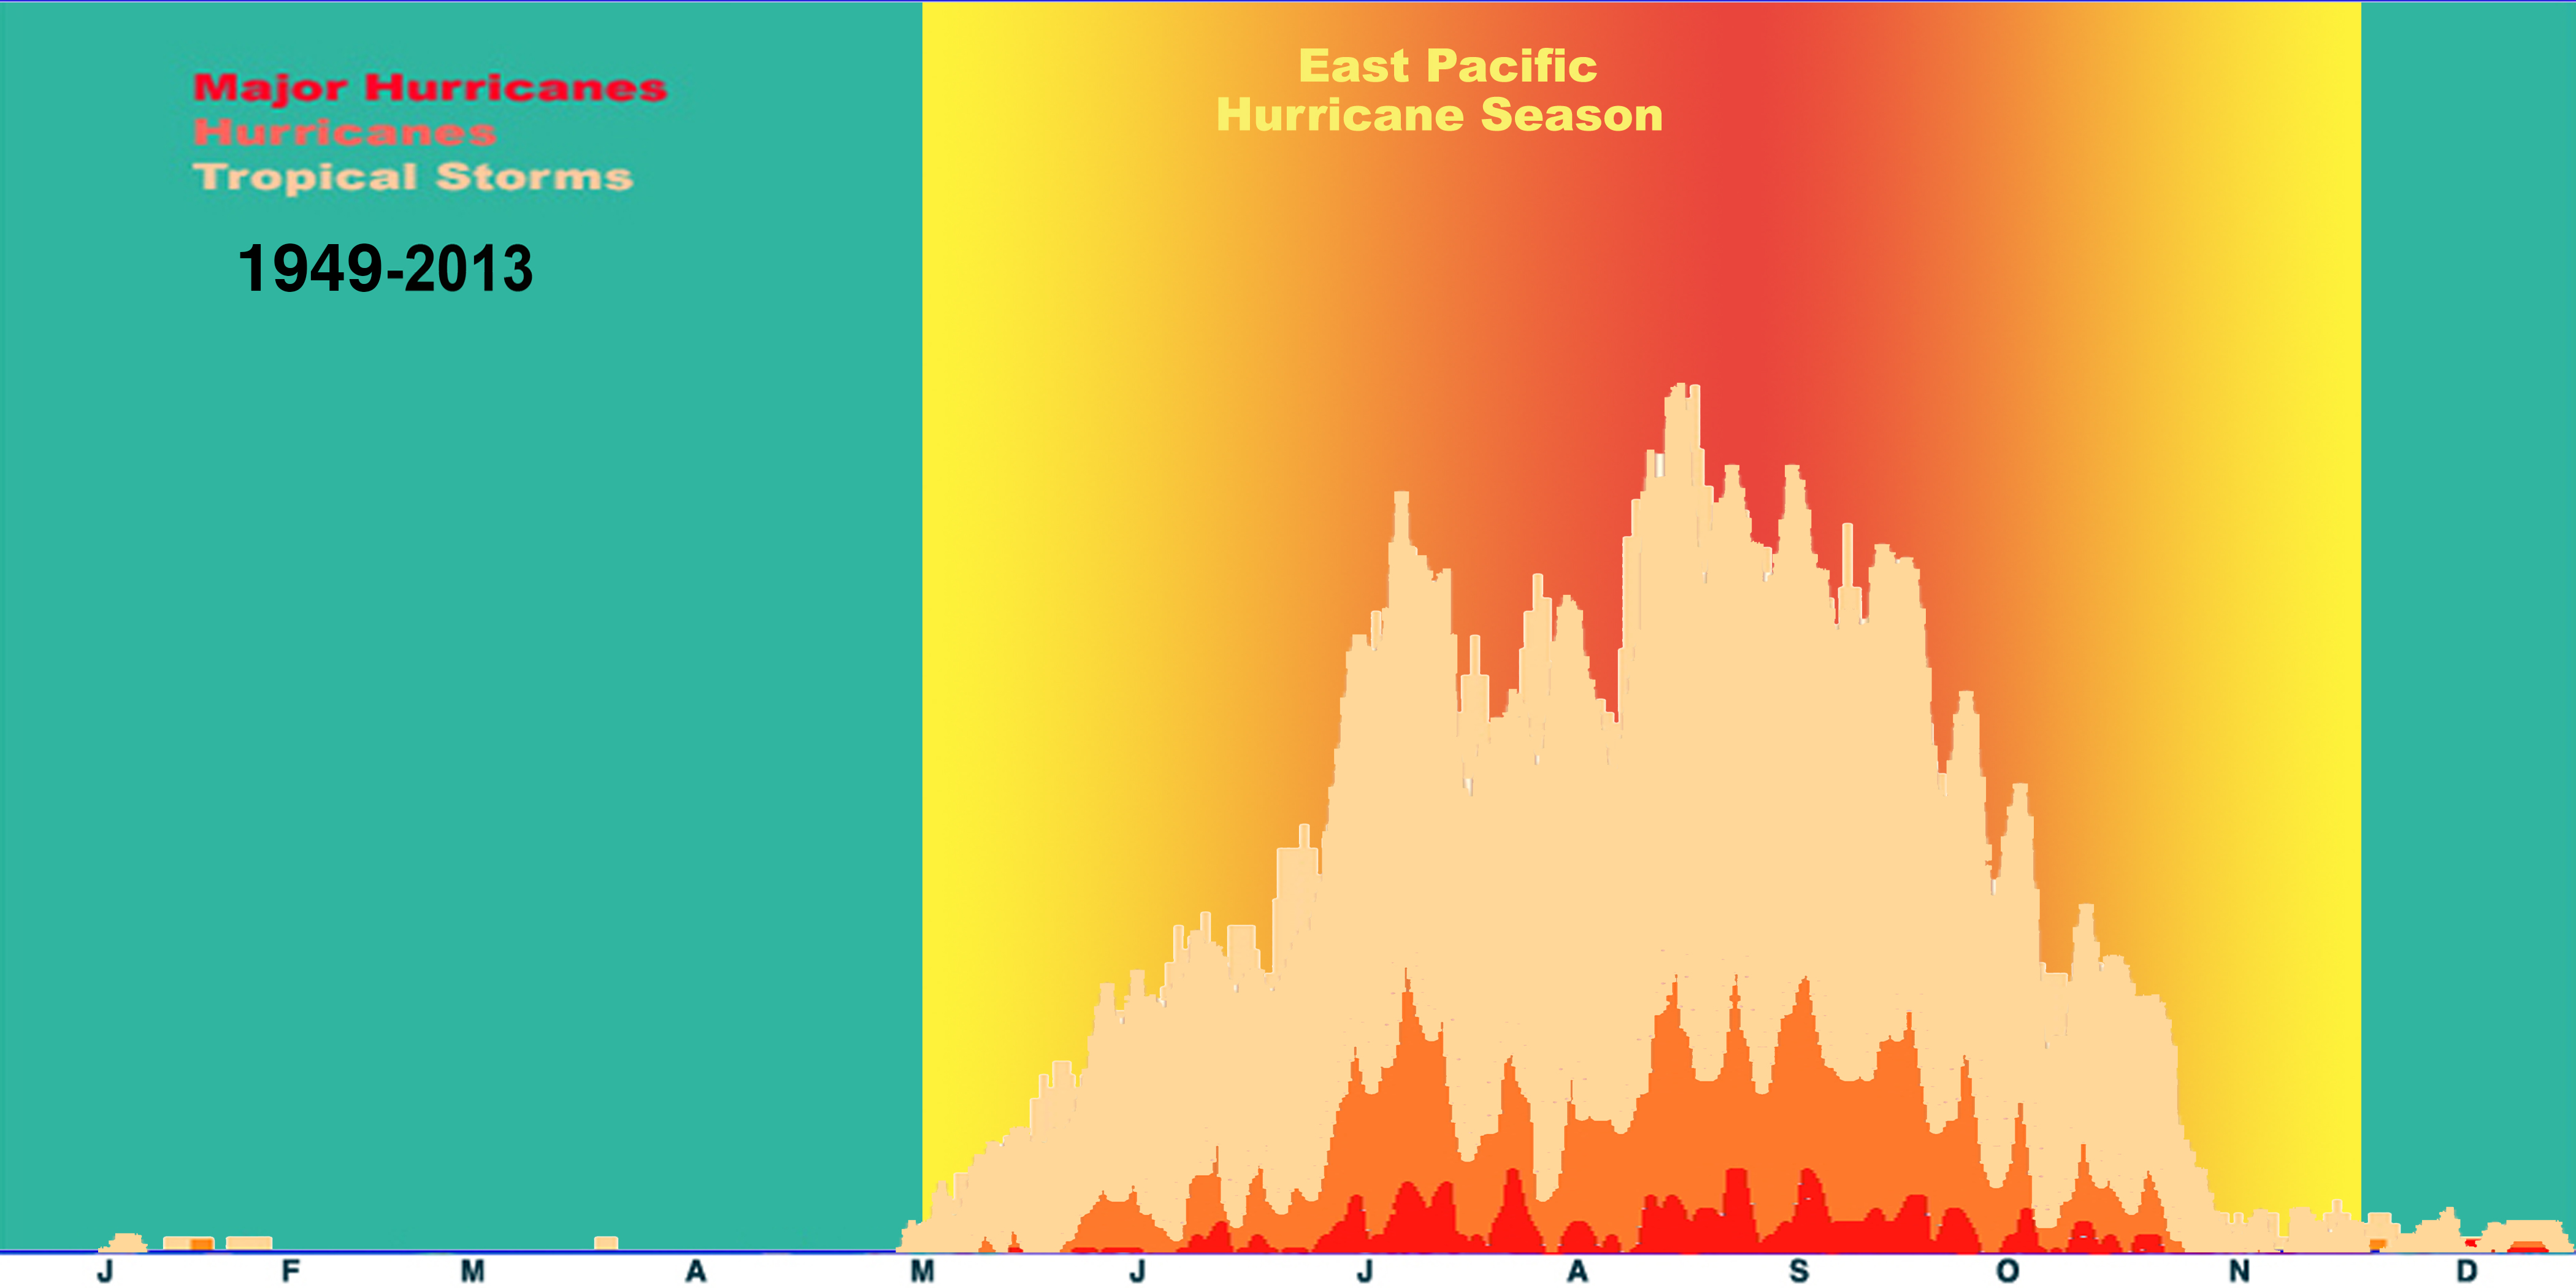

(Figures courtesy of the NOAA Hurricane Research Division)
The figures above show the distribution of tropical storms/hurricanes that form according to month in the Atlantic, East Pacific, and West Pacific Ocean Basins. Clearly we can see that the West Pacific Ocean is active for most of the year, but the Atlantic and East Pacific hurricane season is secluded to the months of May-November (starts in June for the Atlantic).
The good news is that I will continue to watch this ocean basin and make occasional forecasts on hurricanes that form in this area of the world. However, as for the hurricanes that concern most of us in North America, the season is coming to a close…. sadly for me.
This blog will focus on the wild hurricane seasons that occurred around the world for the year 2015.
Hurricane Patricia
Of course we have to start out with this storm. The most talked about storm this year was Hurricane Patricia and how it shattered records around the world. Patricia became the most intense hurricane on record to form in the Western Hemisphere in terms of barometric pressure (879 mb). However, it became the strongest globally with regards to maximum sustained winds (200 mph/325 km/h). Super Typhoon Tip (1979) still holds the world record for having the lowest barometric pressure (870 mb). I remember seeing this storm when it was first developing off the west coast of Mexico and traveling slightly to the north-northwest. Forecasters were expecting this storm to curve back to the east and hit Mexico but they were not expecting a rapid intensification of this system in such a short time. Forecasts were calling for maybe a category 2 storm. However, on October 22 she completely transformed into a monster category 5 system in just 24 hours. The government of Mexico acted quickly and ordered people to evacuate and move further inland and away from Patricia which was aiming to make landfall the very next day. Late on October 23, Patricia slammed into Mexico near Cuixmala, Jalisco as a category 5. Thanks to the high mountains along central and west Mexico Patricia soon degraded into a tropical depression late on October 24. As a tropical depression Patricia exited into the Gulf of Mexico and brought flooding rains to Texas and Louisiana before shifting northward and expanding into a large extratropical system and brought heavy rains to southern Canada and the east coast of the United States.
The miracle of this storm comes from the death count. At first no deaths were reported which blew everyone’s minds. However, after emergency crews worked their way through the damage, 6 people were found dead. However, 6 deaths is impressive considering the strength of this storm. When Hurricane Mitch (1998) came ashore in Central America (Mitch formed in the Atlantic) almost 20,000 people were killed, mostly from the flooding rains. Considering the power and strength that Patricia had when she came ashore we should applaud the Mexicans for their ability to survive and prepare for such a devastating hurricane. A few factors contributed to the fact that many lives were spared. First, when Patricia first came ashore she was already weakening thanks to the mountains that were further inland. Granted when Patricia came ashore she was still a category 5. Second, the size of Patricia was huge. Not as large as Hurricane Sandy (2012) but still large enough to say that this storm was more deadly in terms of rainfall instead of wind. This is where the majority of the deaths In total 6 direct deaths were recorded, 2 which were from wind damage and the remaining from flooding water. Third, the government of Mexico knew for days that this hurricane was going to impact their coastline. Granted they did not expect this hurricane to grow into a terrifying category 5 but they were already in the process of warning people. When Patricia did grow into a record breaking storm the media launched right on it and overtime you turned on the TV it was nothing but Patricia. This helped to get the word out to the people in this area that this storm was a problem. We may bash the media a lot for giving information that is exaggerated or false, but in this case this was perfect for the people of Mexico. Finally, the forth stroke of luck was the area that Patricia came ashore. If Patricia came ashore further south it would have gone through an active tourist area with an increased population. Instead Patricia delivered the strongest winds to a rural area of Mexico where the population was low. We could have had a larger death count if this system shifted its course just slightly.
Patricia winds the award this year for the most talked about storm no questions about that; records were broken but the greatest victory was that Mexico was well prepared for this storm.
East Pacific is Experiencing a 2005 Atlantic Season
So while I am suffering with a very quiet Atlantic Hurricane Season the Pacific Ocean is on fire, literally. Thanks to this enormous and vigorous el Niño the Pacific Ocean waters are warmer than usual and wind shear values are very minimal. This is creating a breeding ground for hurricanes. It would not surprise me to see more hurricanes form this year in this ocean basin thanks to this climatological phenomena.
So we all probably remember the 2005 Atlantic Hurricane Season where we had Hurricane Katrina and Wilma. Well, the Pacific Ocean is basically having this season now.
2015 has so far set a record for record-high activity in the Central Pacific Ocean (area defined between the International Dateline and 140ºW. 15 Tropical cyclones have formed in or entered into this area this year. Also, so far the East Pacific has set the record for the second most active season in terms of the Accumulated Cyclone Energy (basically a scale system that determines the amount of energy each cyclone has added all up).
Hawai’i had a lot of scary moments where hurricanes came very close to making a direct hit. Some of these passing hurricanes brought some rain, wind and huge waves to the islands (surfers must have loved this year). Luckily the islands were spared from a direct hit but they have had a lot of close calls this year. Many would think that Hawai’i would be a common place for a hurricane to hit. However, it is pretty rare when you start looking at the data. This has a lot to do with where Hawai’i is situated. Hawaii is very far out to sea. Most hurricanes in the East Pacific are forming right of the coast of west Mexico and then traveling east or northeastward. By the time a hurricane gets about half way to Hawai’i it will either hit an area of cool water or a turbulent atmosphere layer and fizzle out. However, many of these hurricanes survived and made their way close to the islands. Some even reaching up to major hurricane status. Hawaii is also very close to the equator. Hurricanes do not form right on (or even close) to the equator. This has to do with the corriolis effect and the amount of instability in the atmosphere. There is a lot of shear that takes place along the equator and would tear up any storm that tries to form here. This isn’t to say that it does not happen, it is just not likely. We did get a few hurricanes that tracked to the south of Hawai’i very close to the equator but it is important to note that these storms were fairly weak in strength.
We also had some fun times with other hurricanes that formed in the Pacific Basin including Hurricane Kilo.
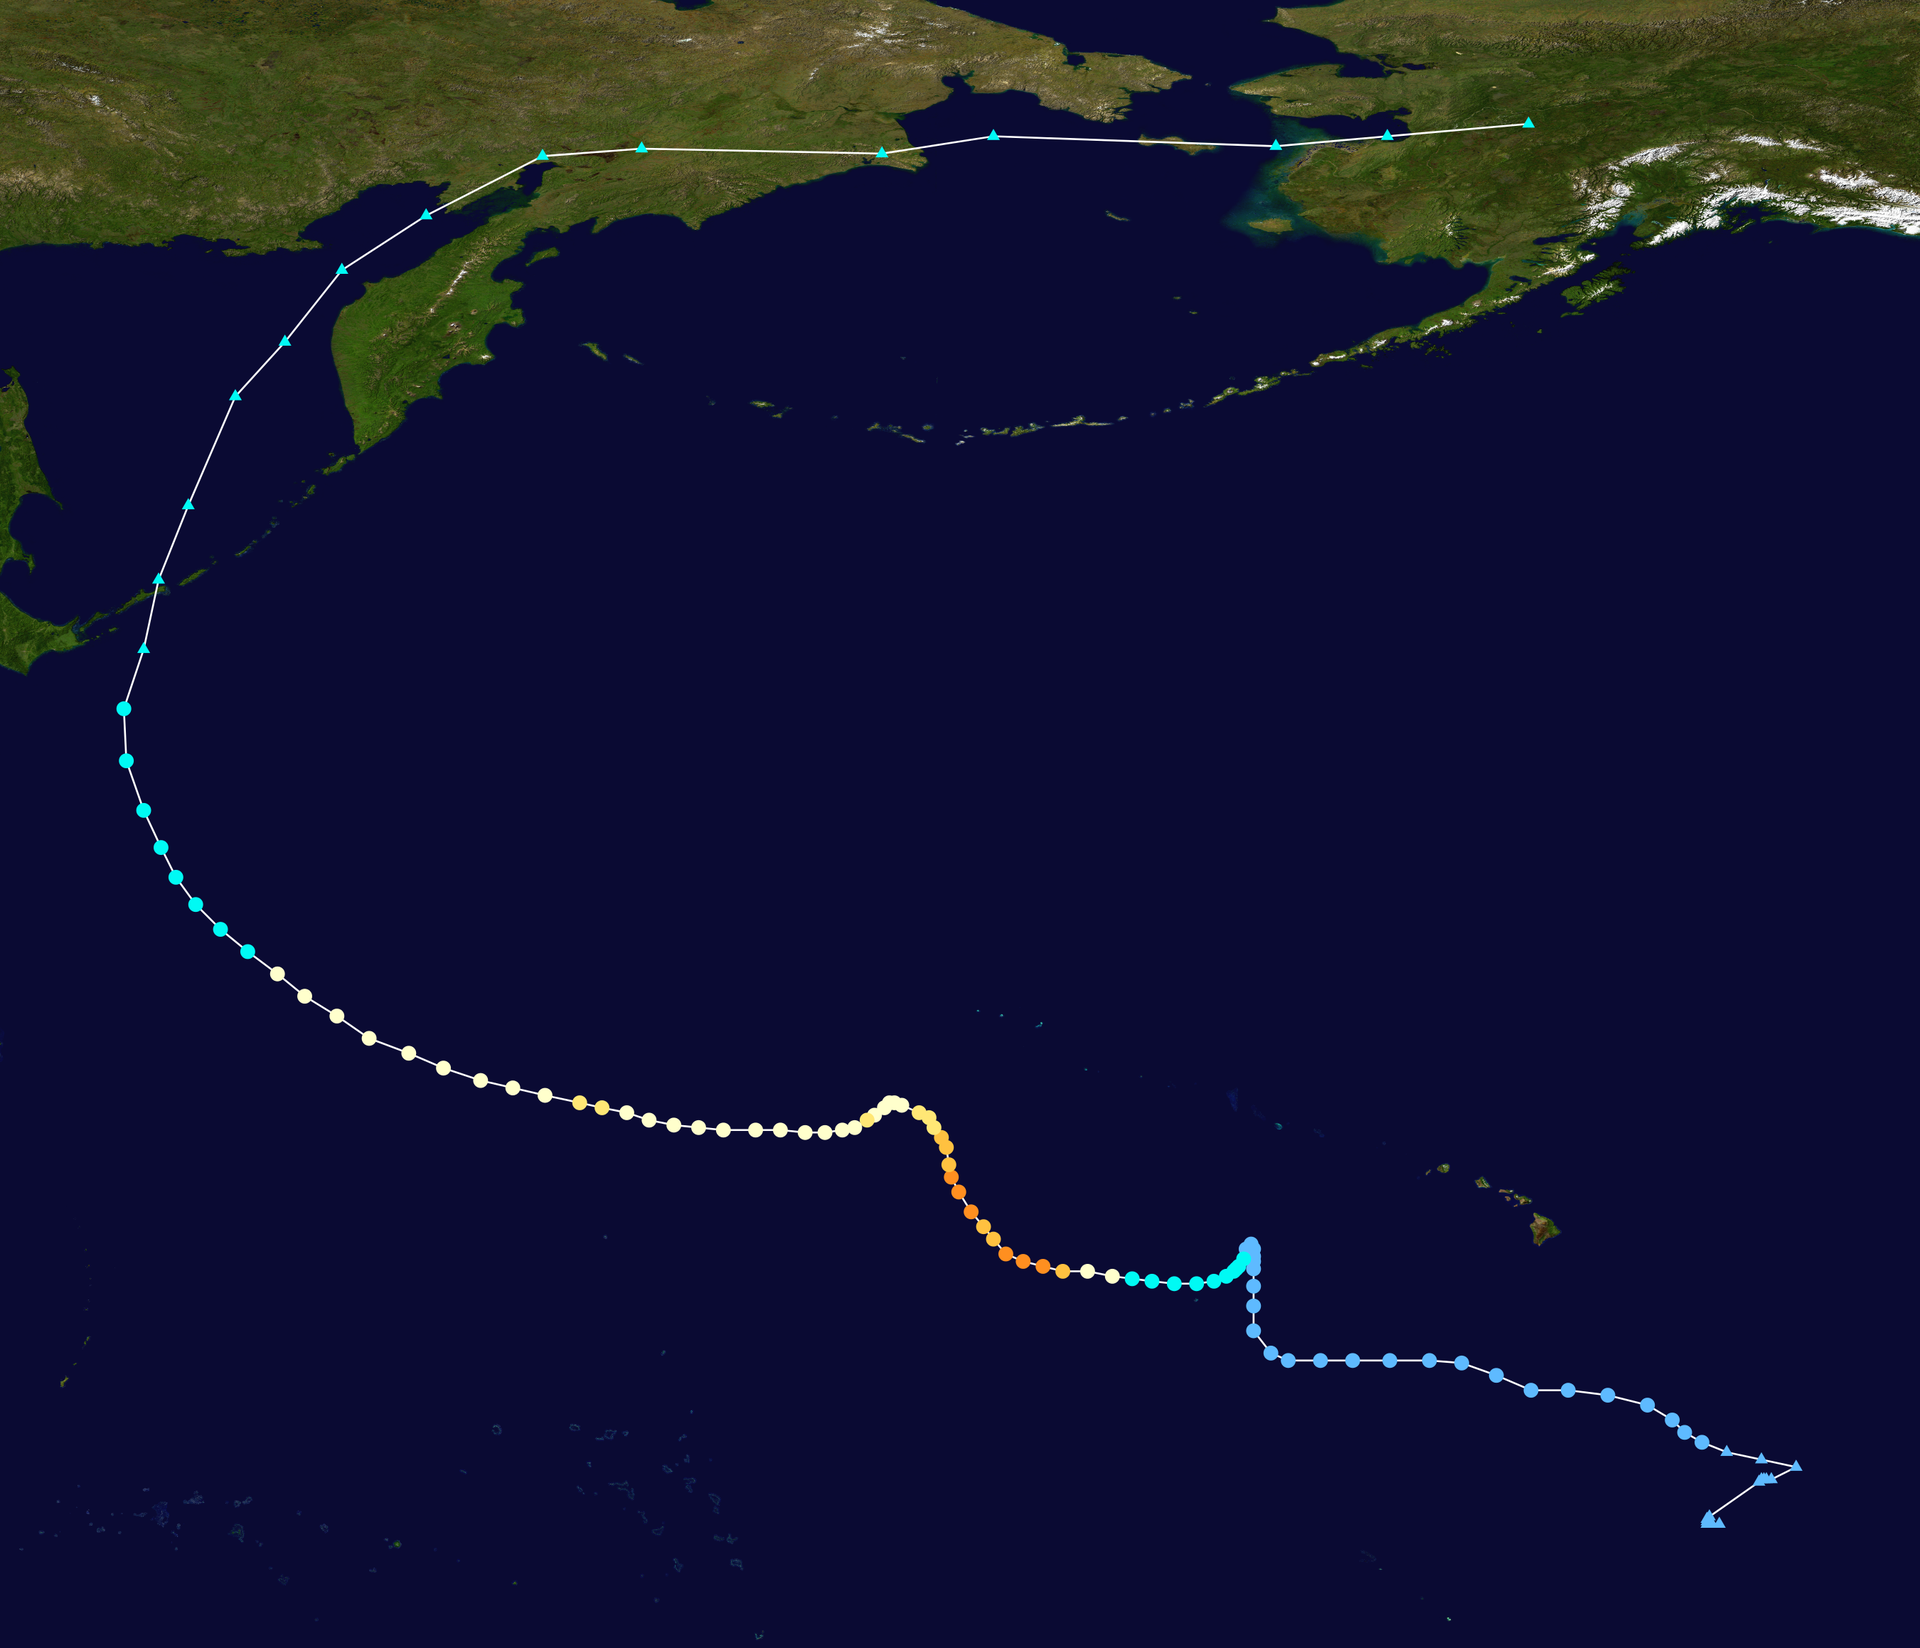
Kilo went on a very long journey starting just south of Hawai’i, crossing the International Date Line, growing to be a strong Category 4 hurricane, crossing into Russia as tropical storm (although it transitioned into an extratropical storm), crossing the Bering Sea, and hitting Alaska (still maintaining tropical storm strength). Hurricane Kilo became one of the longest lived tropical cyclones on record lasting a total of 22 days (Sullivan, B. K. (2015)).
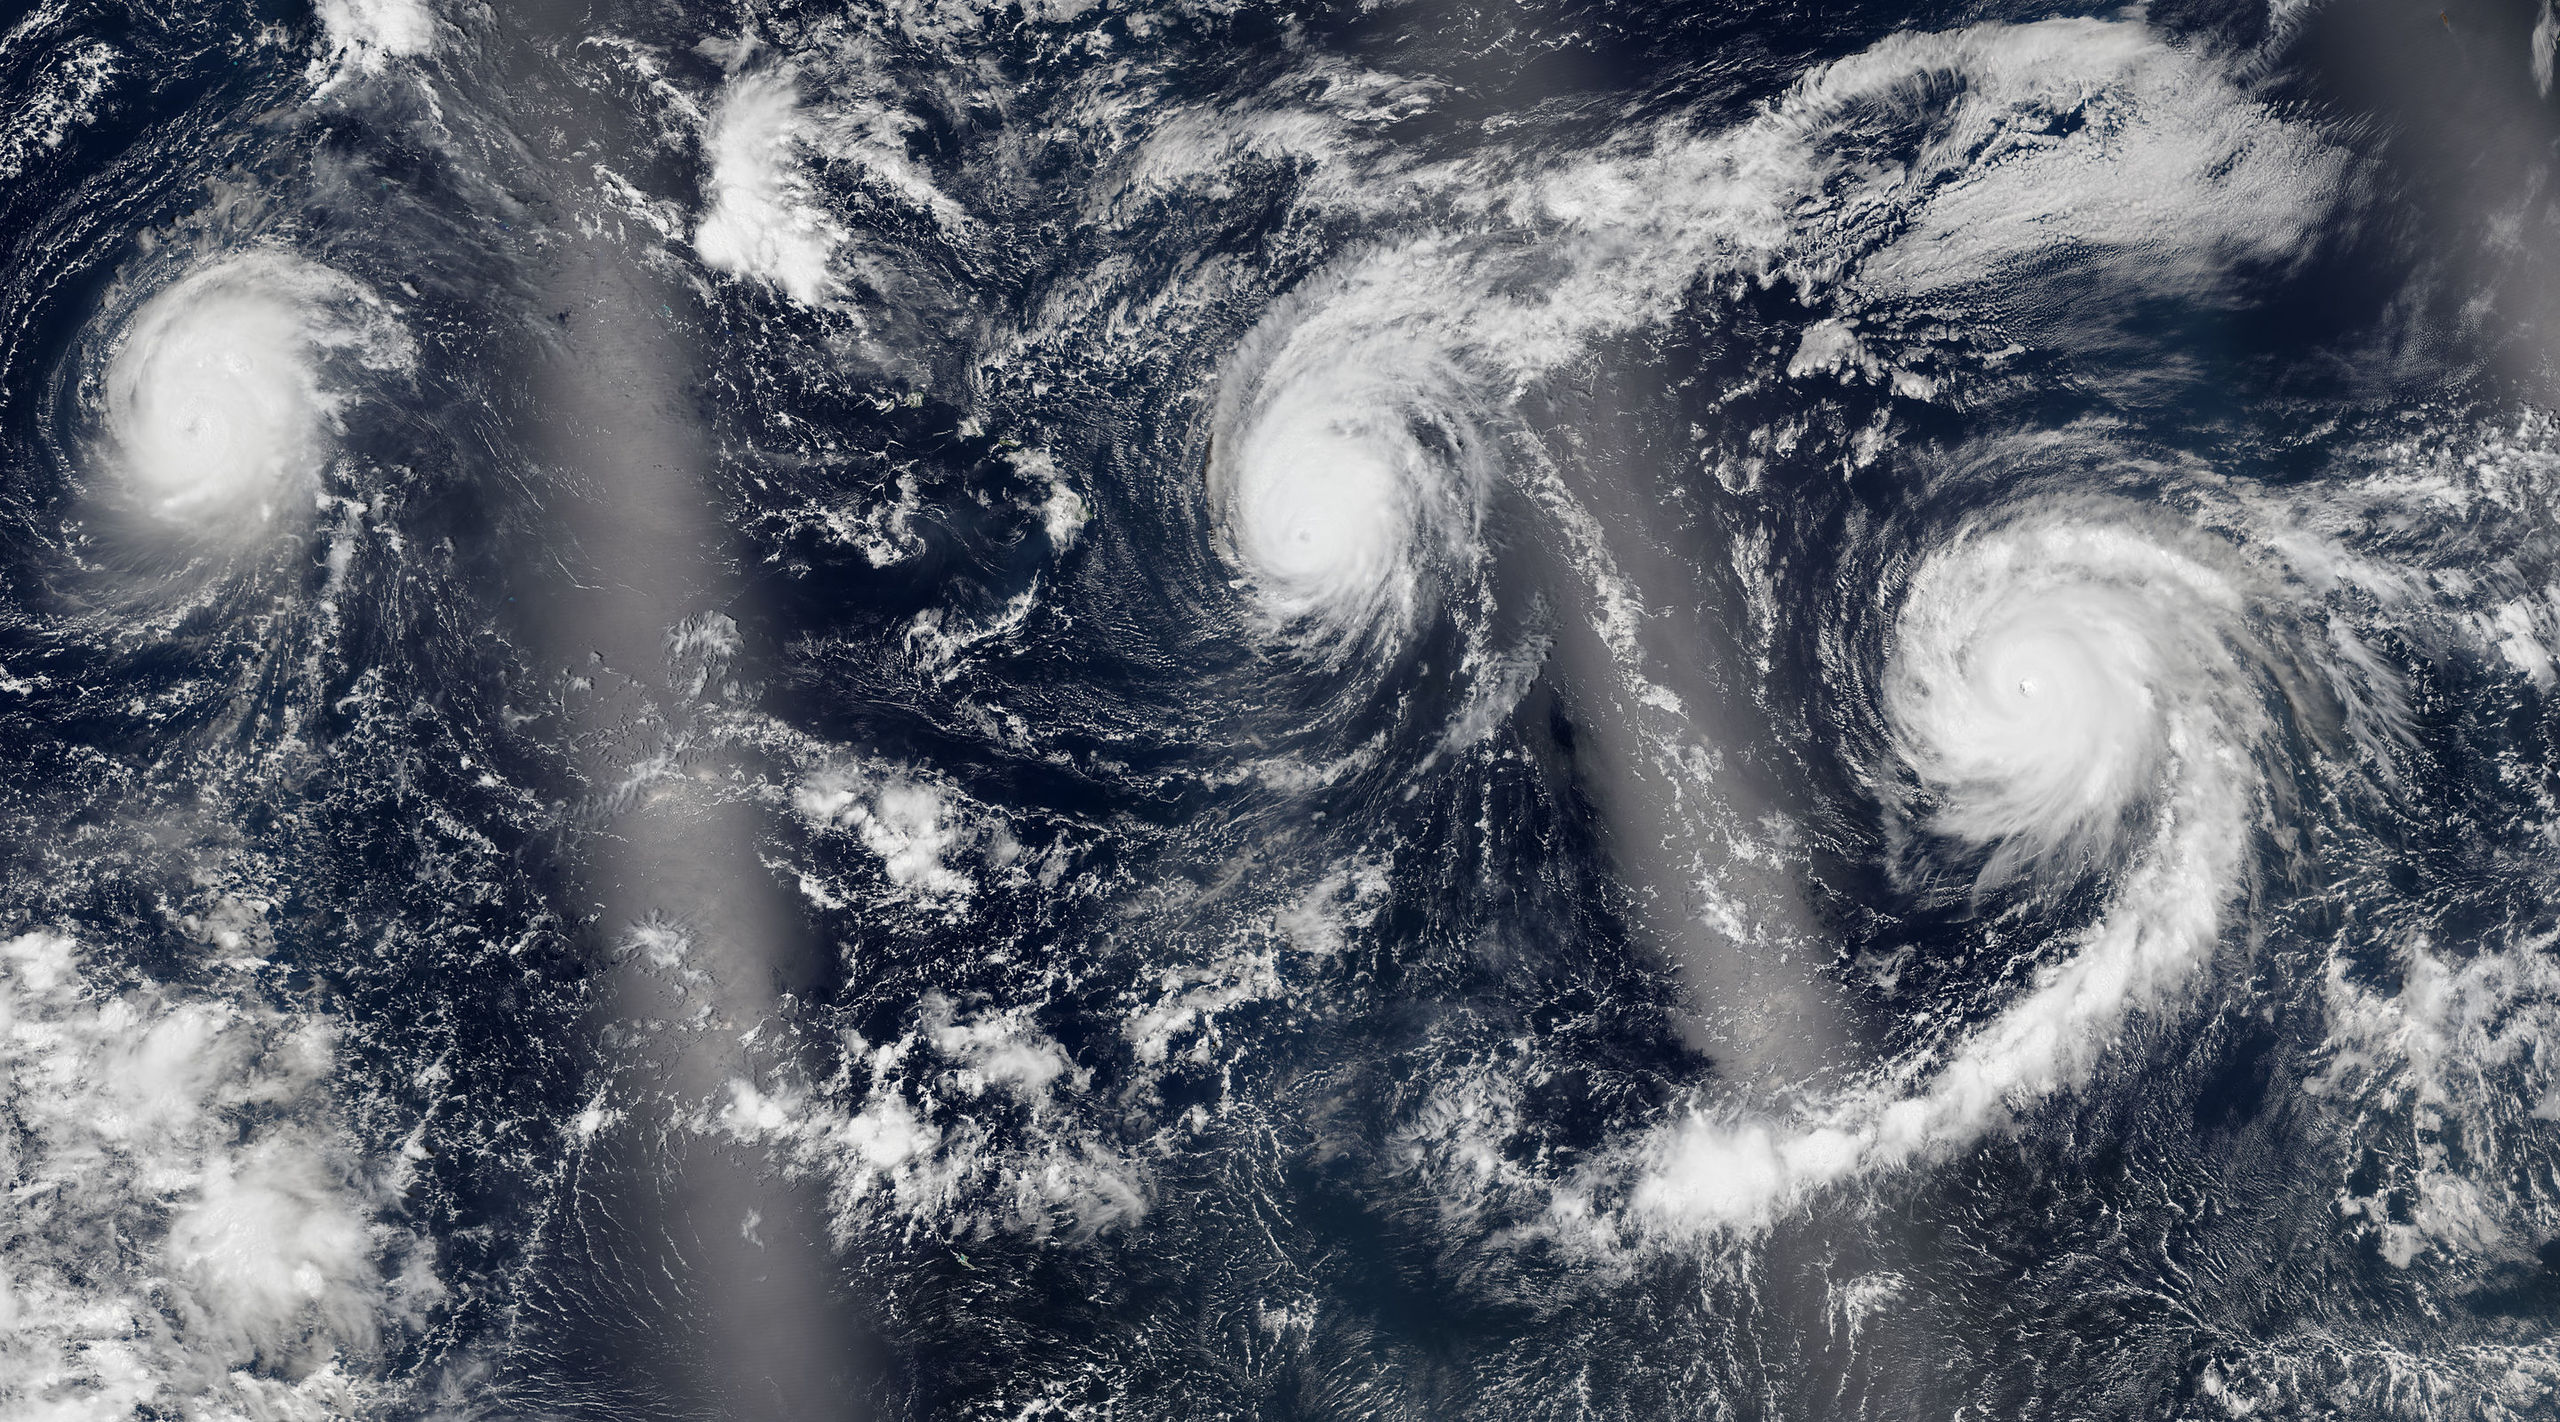
At one point we had three hurricanes reach major status (category 3 or higher) in the Pacific Ocean. On August 30, Hurricane Kilo (left), Hurricane Ignacio (center), and Hurricane Jimena (right) were spinning in the central and eastern Pacific. Impressive to see so many intense hurricanes alive all at once.
We also had Hurricane Ignacio which came ashore in British Columbia as an extratropical storm but still retained the winds of a tropical storm.
Only light rain and a few clouds were reported in British Columbia but the days leading up to this storm were insane. Surfers from all over started to run to the beach to catch the best waves that Canada has probably ever seen. Not surprising really, it is rare for British Columbia to be visited by a storm such as this.
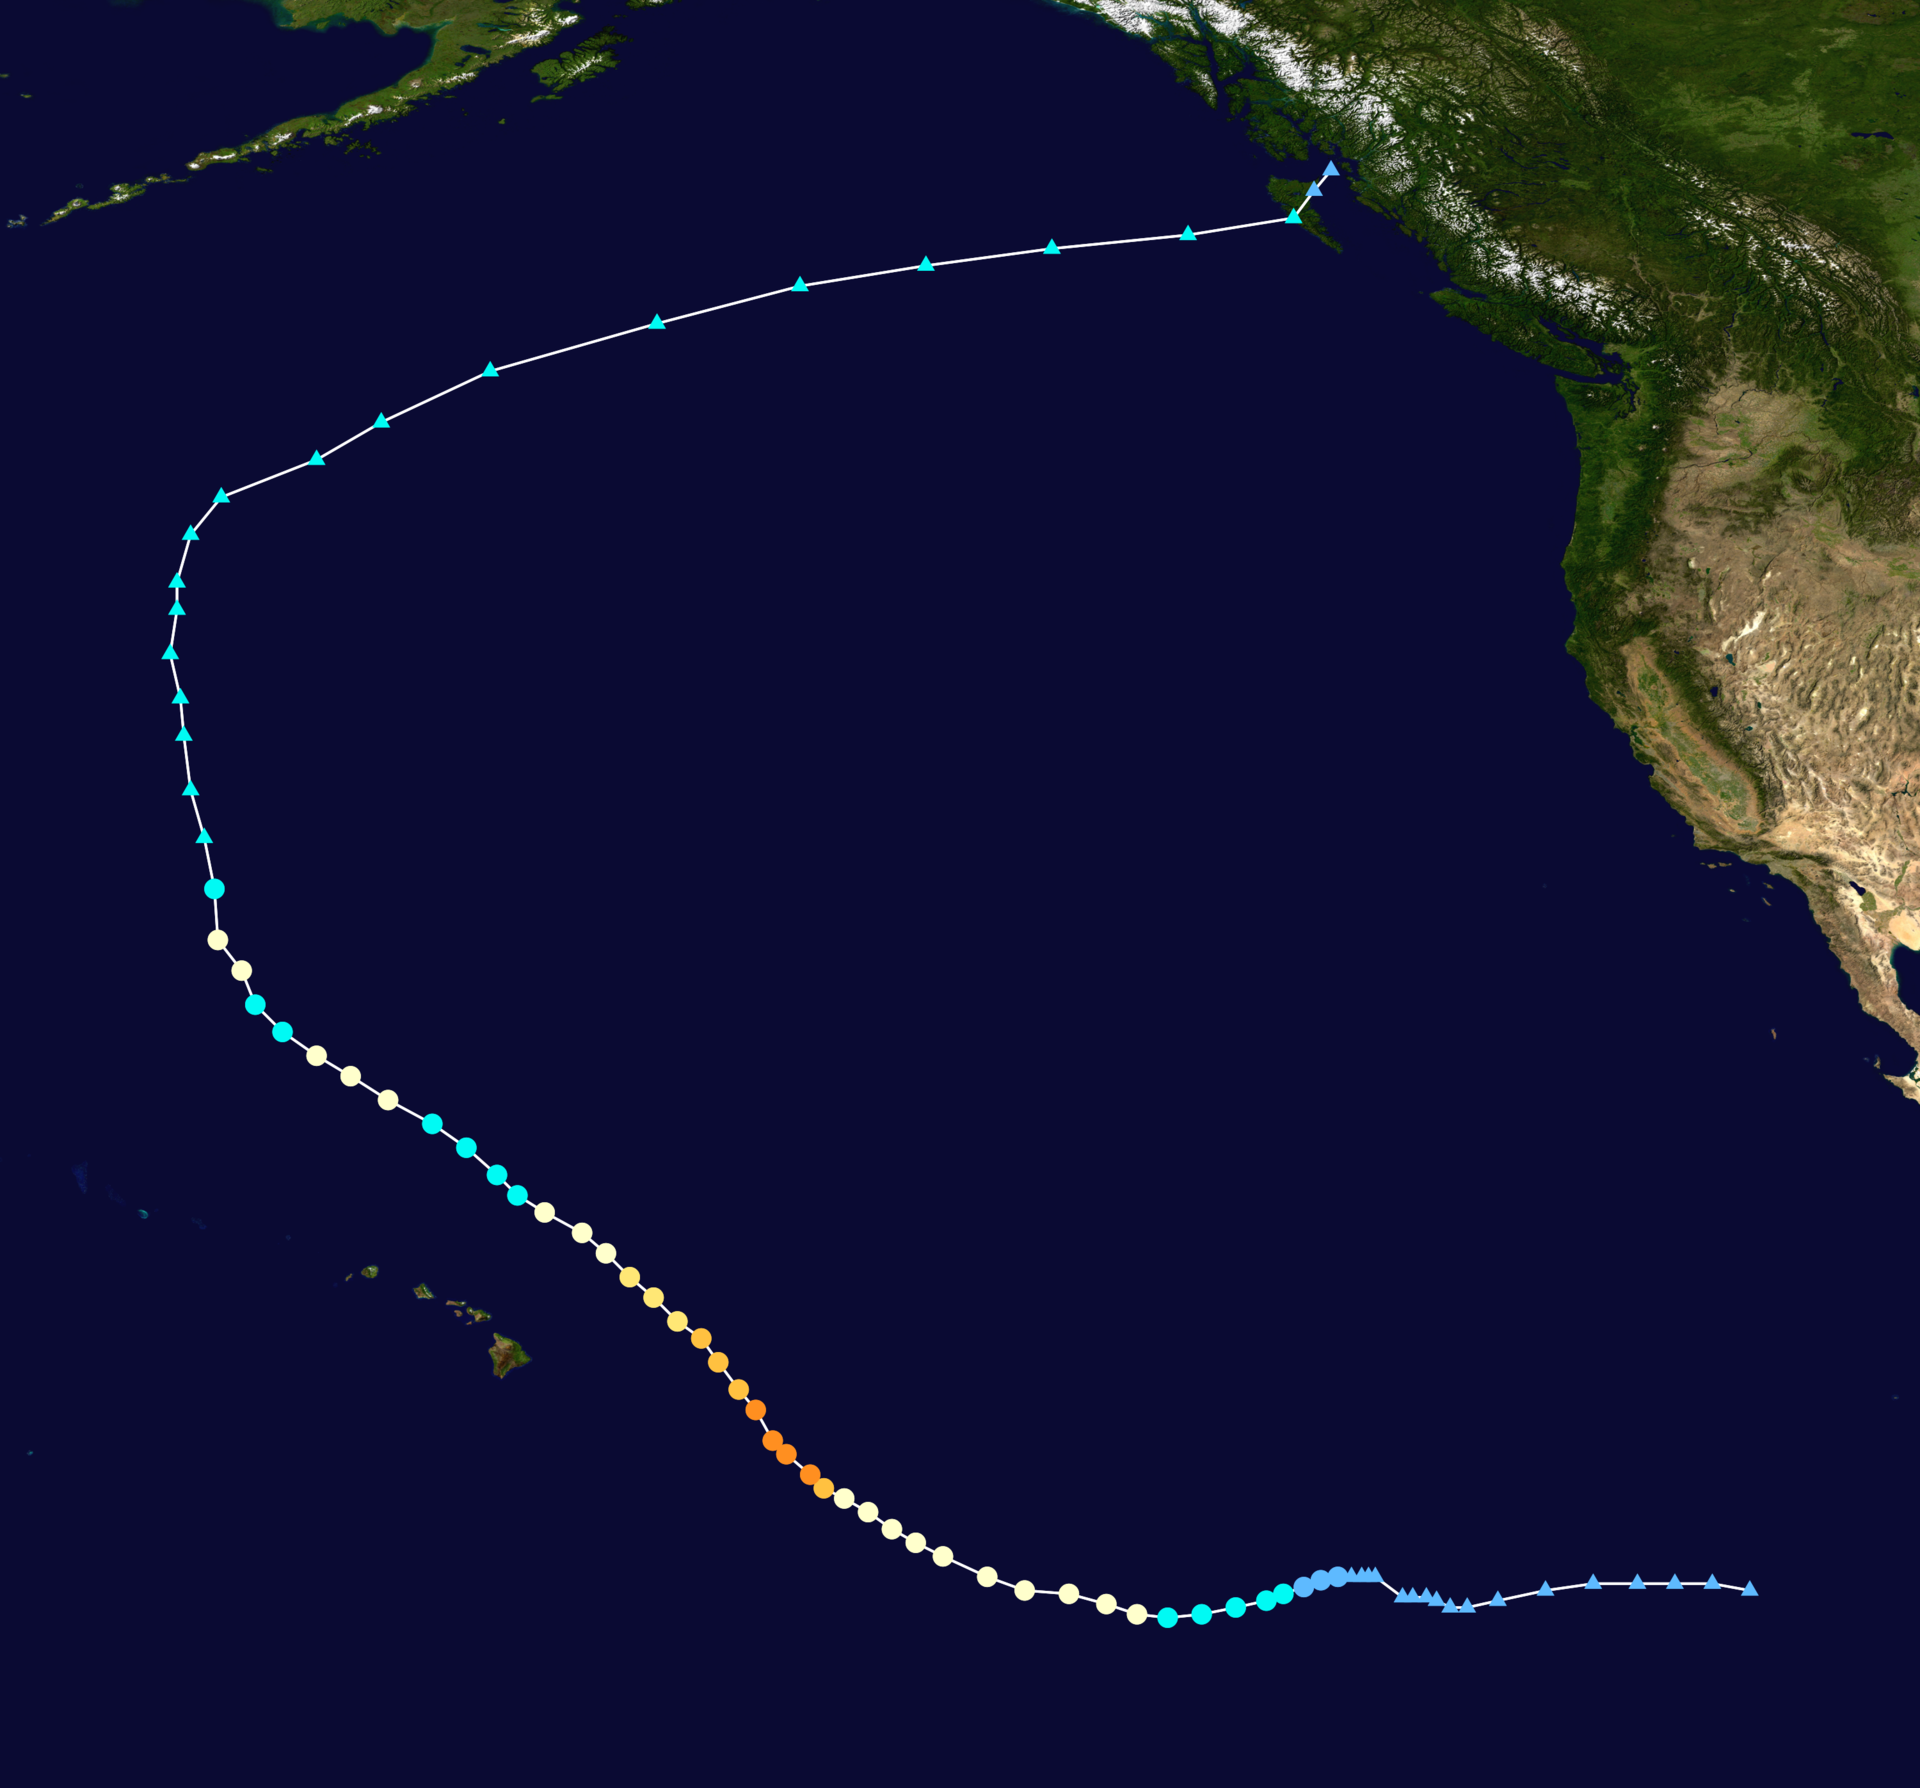
Soon after we had a similar storm take a similar path to Canada, Hurricane Oho. Similar to Ignacio Oho transitioned into an extratropical system and continued north into Alaska. Yet, the waves still called the surfers in British Columbia… and thus everyone went back out to surf the swells. However, Hurricane Oho was special in another way, the forecasted track. When we all look at the big and scary “cone of uncertainty you expect that the further out you get the wider the cone. Not in this case:

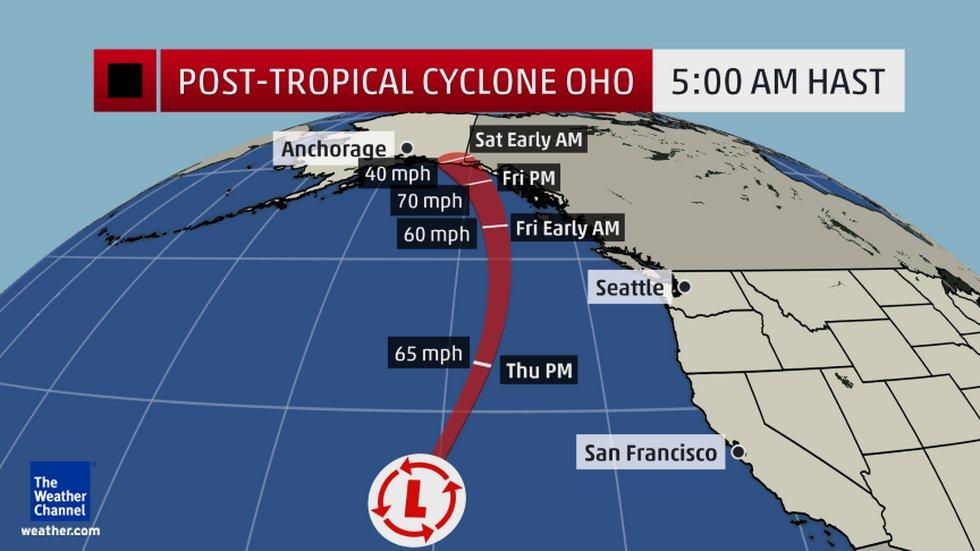
This is probably the skinniest cone of uncertainty that I have ever seen. The forecasters must have been REALLY sure about their forecast. Impressive.
Quiet and Boring Atlantic
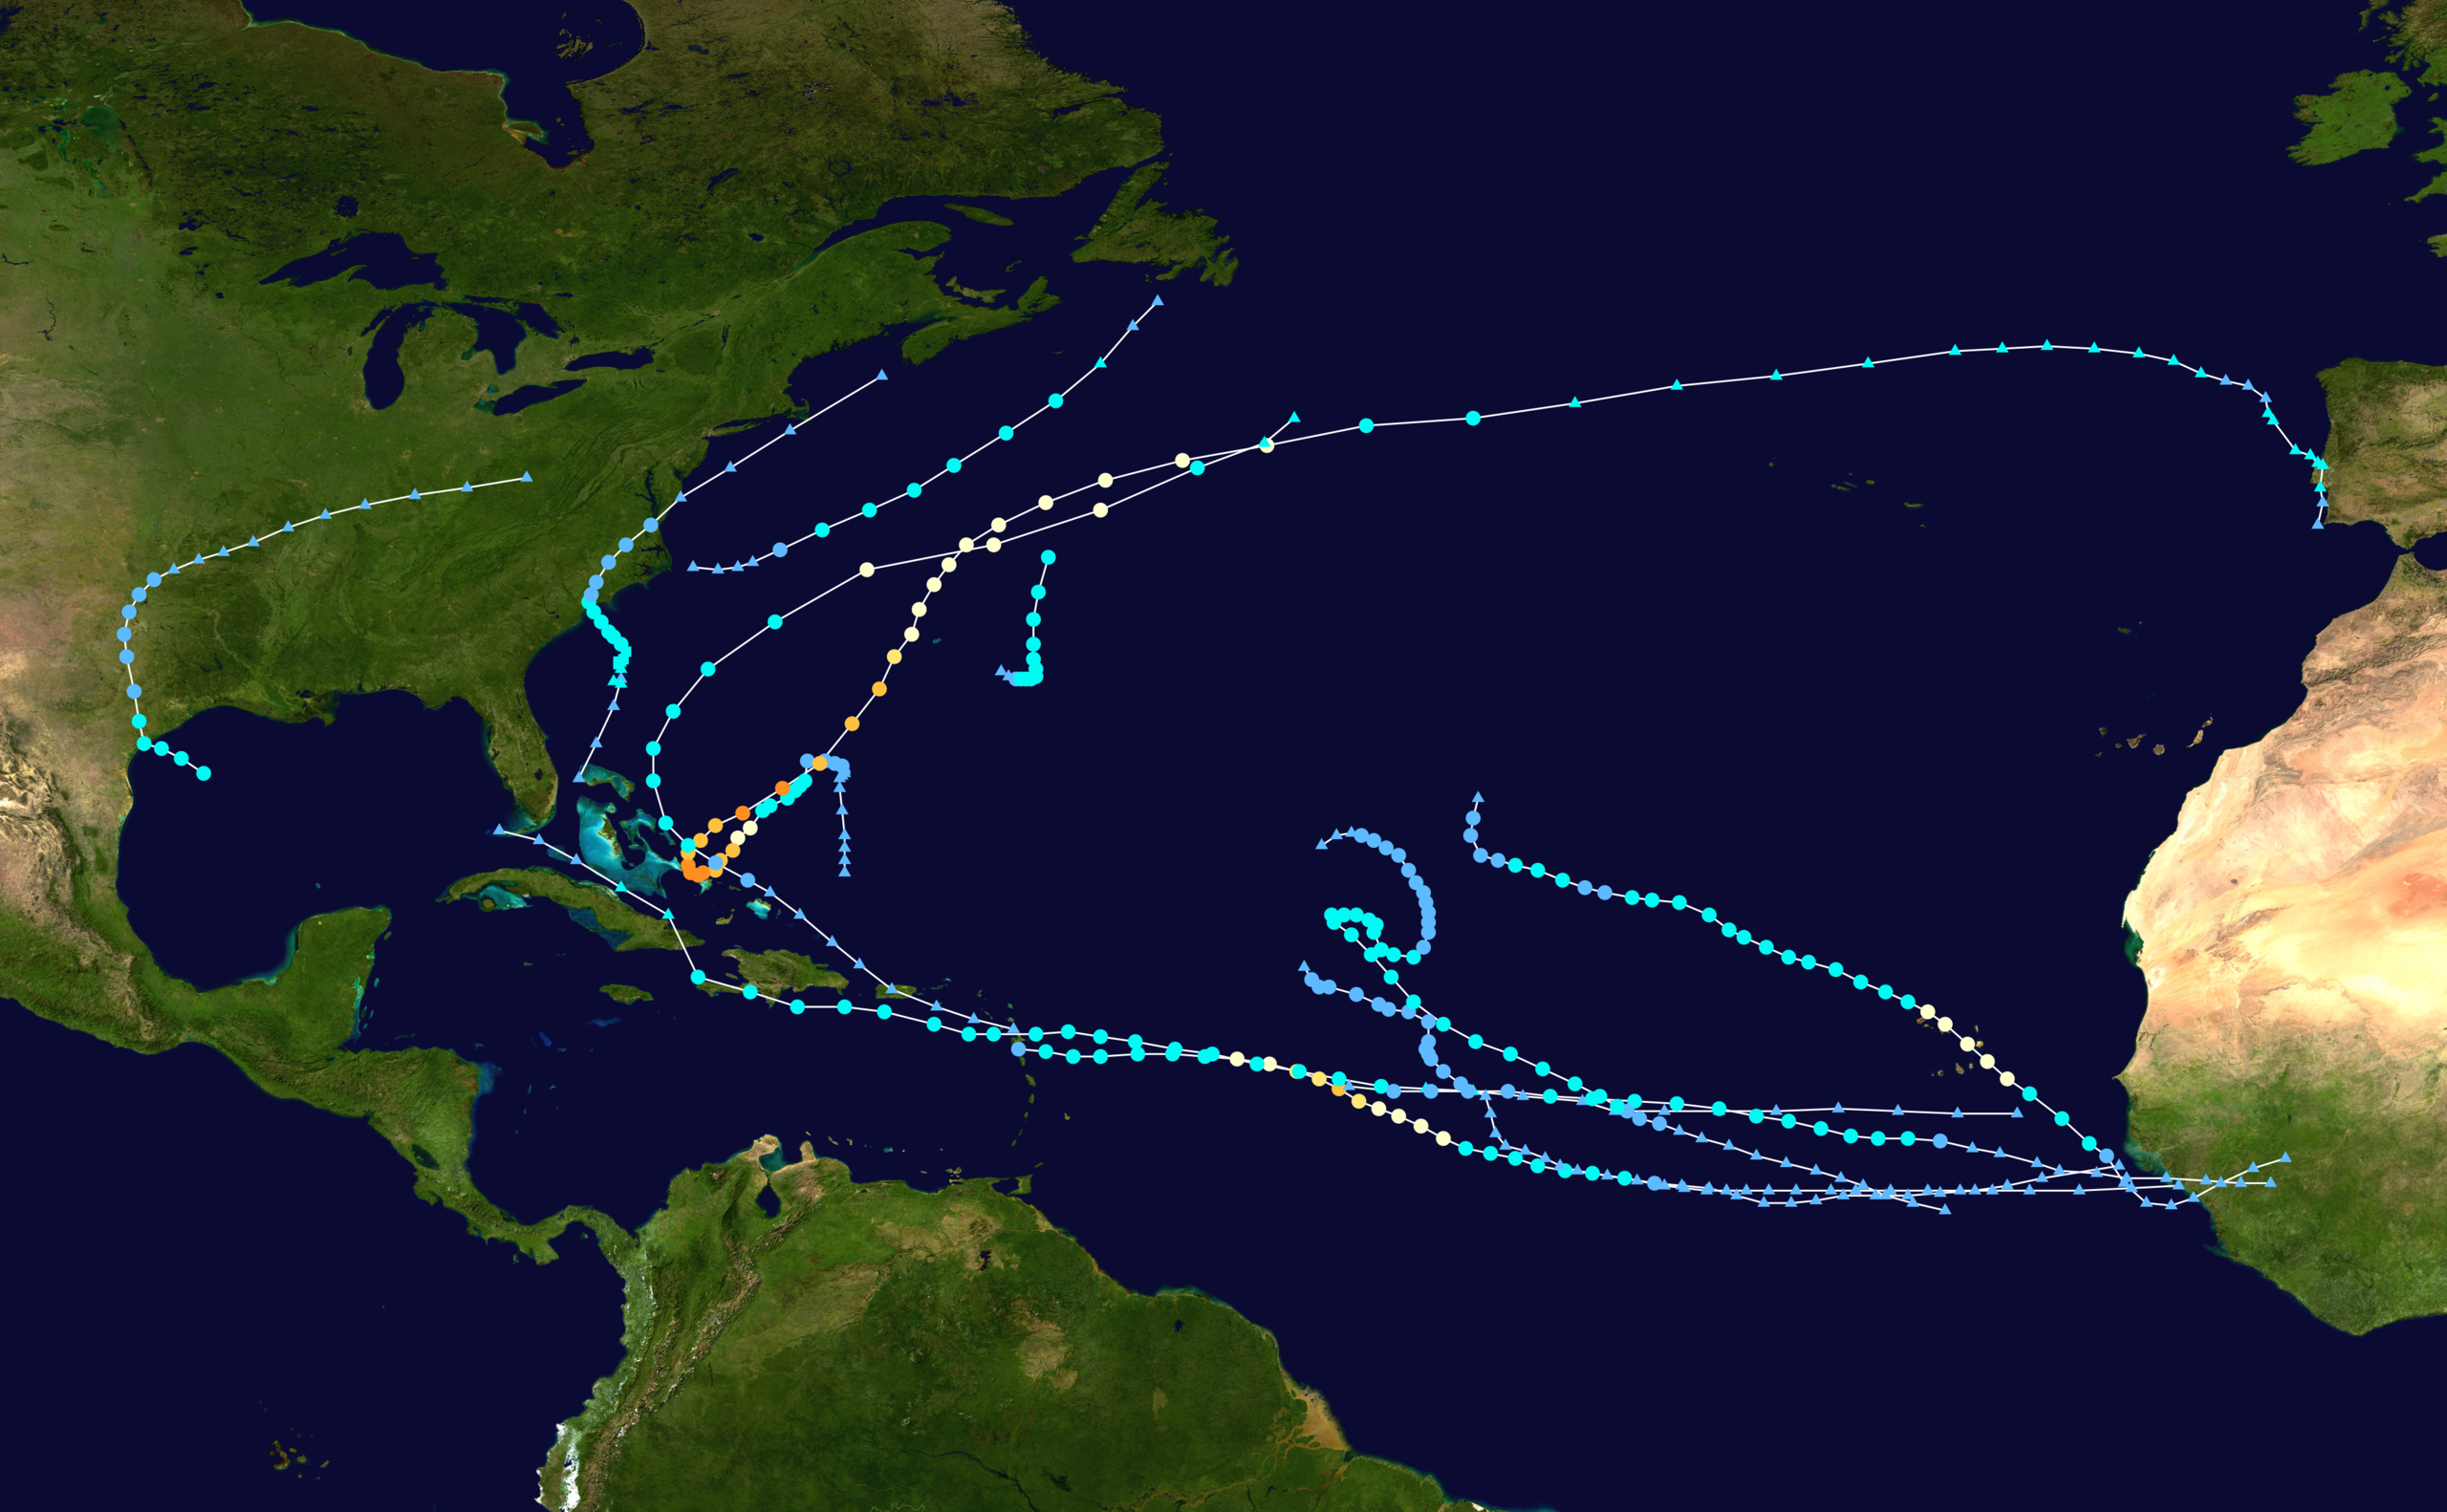
As many of you know by now my research and passion is focused on hurricanes forming in the Atlantic. This year was very sad for me, but this was to be expected. Thanks to the “Godzilla el Niño” the waters in the Atlantic are cooler than normal this year. Hurricanes need ocean waters of at least 26.5ºC to form. Wind shear was also strong this year which caused a lot of storms trying to develop to be ripped apart.
As of today (November 30) 12 named storms (tropical storm and higher) formed in this basin, 2 of which reached major status (Cat. 3 and higher). This hurricane season is below average for the frequency of storms that formed. We can’t say it was all boring though. Tropical Storm Erika was the storm that made us all grind our teeth as forecasters kept warning of Erika strengthening into a hurricane and hitting Florida. This was big news since Florida has not been hit by a hurricane in 10 years (tropical storm yes, hurricane no). So of course the media and government (and even me, sadly) got all excited and started issuing panics to the public. The funny part of this storm was that Florida issued a state of emergency a couple days before this was expected to hit. People started to rush out to gas their car, collect water and food, and install hurricane shutters. So what happened?… Erika dissipated before coming anywhere near Florida… cue the sad music. No doubt after that incident Floridians started to post pictures such as:
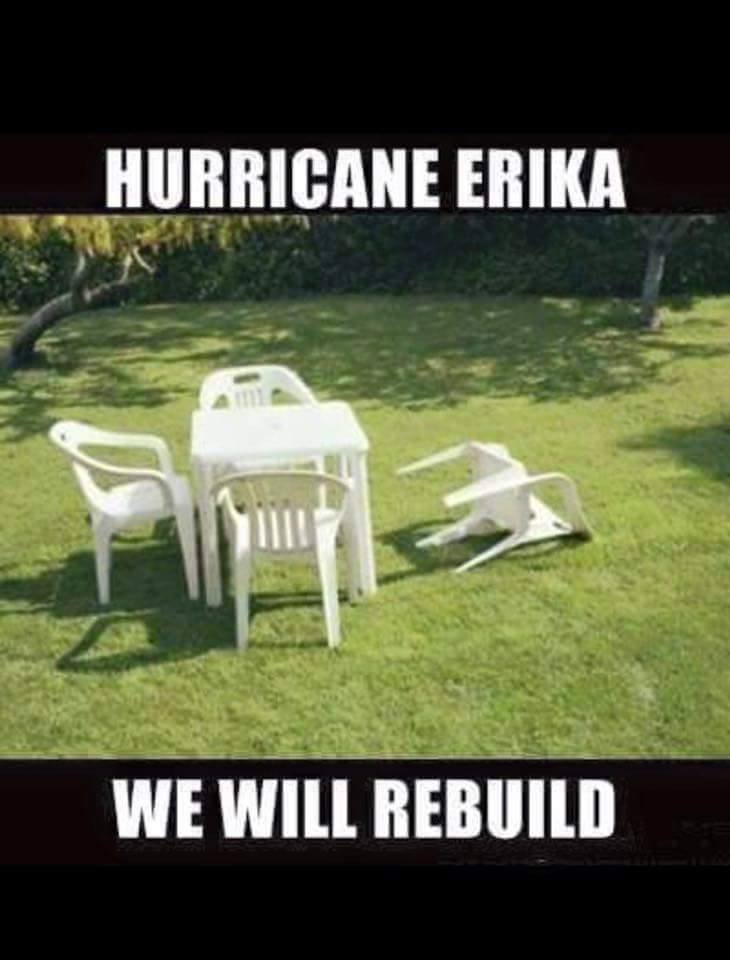
(Courtesy of Odyssey)
So yes, Erika was a tricky storm to forecast. Each day I woke up to see that the hurricane center changed their track forecast and intensity forecast. It was enough to drive me up the wall. It also did not help that I was busy moving back to Toronto during that week which made my forecasts… well, impossible. Sadly, this will continue to happen. Erika is a reminder that meteorologists still have a lot more to learn about the atmosphere and how it works. If a meteorologist ever tells you that they can predict your forecast with 100% certainty, they are insane and lying. To be a meteorologist you have to realize that nature and weather will always win and you will be wrong a lot. We just do not know our atmosphere very well at all. It’s like the bottom of the ocean. We have only discovered about 2-5% of the ocean floor. In my opinion we have only understood maybe 2-5% of the atmosphere as well. So being a meteorologist is probably, in my opinion, one of the hardest jobs in the world. You want to be perfect but you just can’t on somedays… and then it is the cherry on top when the angry bride stomps over screaming that there is a little drizzle passing overhead even though you stated there was a 30% for rain.
Even though Atlantic Hurricane Season 2015 comes to a close today it is not out of the question to see another tropical system form, although given the quiet year we have been having (thanks el Niñ0) it is doubtful that we will see any surprises. So here is an example of my sadness this year:
While I was dealing with tiny disturbances which yielded almost no formation, anyone studying in the Pacific Basin was having a wonderful time…
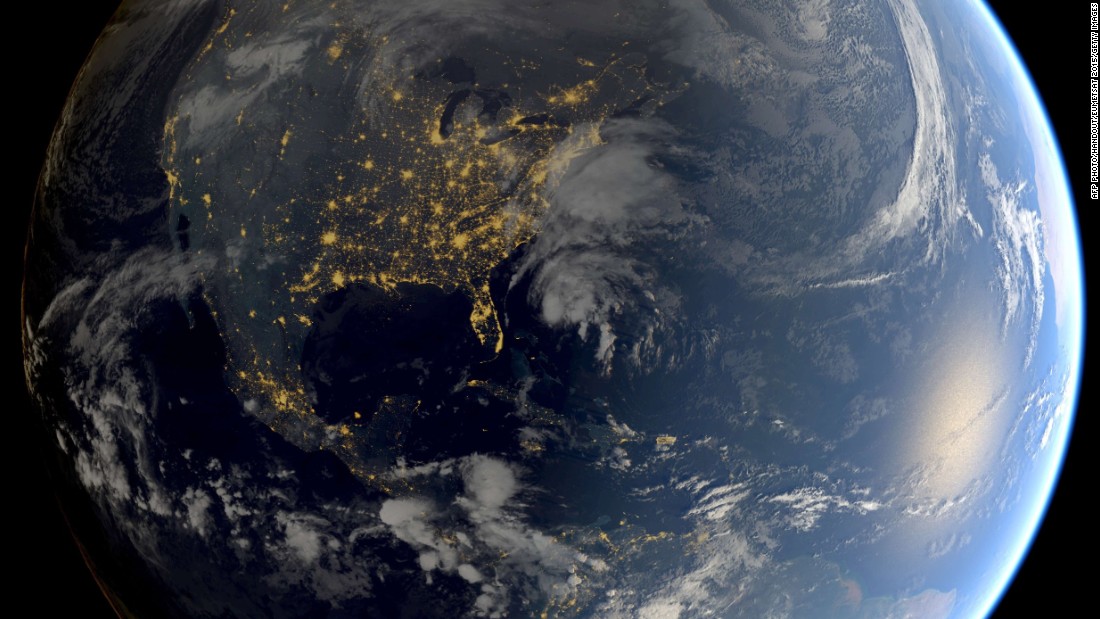
But I leave you with a nice photo from space of our final hurricane (undergoing extratropical transition off the east Florida coast) for the Atlantic Basin this year: Hurricane Kate.
Indian Ocean Mayhem
This was my first year paying close attention to the Indian Ocean. Usually I would just see if a hurricane (known as a cyclone in this basin) formed from time to time and look at some of the maps. However, this year was a record breaking year for them. Cyclones typically form in the Indian Ocean between April and December with the peak being from May to November. Yet, on average this ocean will see about 4 cyclones form each year. Currently there have 8 storms forming of which 4 have been named. 2 of these systems ranked as “extremely severe cyclonic storms” (equated to a category 3 or higher). These 2 major cyclones occurred within one week of each other and both hit almost the same area in Yemen. Yemen is not known for cyclones. This is usually thanks to the Red Sea and the Gulf of Aden. Yemen is secluded away from the Indian Ocean but lies along the Gulf. A cyclone has to track into the Gulf of Aden in order to reach Yemen. This is very rare.

(Cyclone Chapala on left and Cyclone Megh on right off the coast of Yemen in November)
Cyclone Chapala became the most powerful storm on record to hit Yemen on November 3. Chapala came ashore as a category 3 system (estimated). Strong waves, high winds, and heavy rainfall affected southern Yemen. Some areas received 24 inches of rainfall over a 48 hour period. This was 700% of the average yearly precipitation for the area. Wow. Thanks to the dry air surrounding Yemen Chapala quickly died out and became nothing more than a wind storm.
A week later Yemen was hit again by Cyclone Megh. However, this system was not as strong as Chapala and came ashore as a tropical depression bringing more rain to the areas that were already affected by Chapala. The island of Socotra (which was also hit by Chapala) received the brunt of Cyclone Megh (brought category 3 winds to the island).
The Indian Ocean season is still ongoing for another month. So I will keep an eye on this basin to see if we see anymore interesting formations. There is very little research regarding cyclones in this basin and it would be interesting to see if el Niño affects this area. This could explain why there is an increase in cyclone activity for the Indian Ocean this year.
Final Thoughts
I will continue to update this article as I find more interesting topics that have occurred this year but for now we can say that without a doubt this has been a very active and wild hurricane season around the world. Even though the Atlantic was quiet the rest of the world was very active. We mostly have to thank el Niño for this high activity.
I will continue to report on any interesting hurricanes that will continue to pop up in the Pacific and the Indian Ocean as well.
However, here is my long term forecast for next year in the Atlantic Basin. I am expecting it to be very active. Theses from statistical data showing that after an el Niño, especially a major one like this one, the oceanic cycle switches to a la Niña. From past blogs I have written in the climate change section, this will create a warmer situation in the Atlantic Ocean allowing more hurricanes to form. So maybe this wasn’t the most active year for my research but that could be next year 🙂 Looking forward to it and hope you all are too. Start preparing now! 😛